-
Colleges
-
Graduate School
- Graduate School
- Scout Grad School Search Find and compare grad schools based on your preferences, goals and academic interests.
- $5,000 Grad School No Essay Scholarship Enter to win our $5,000 no essay grad school scholarship in 2 min or less.
- Graduate Degrees Explore graduate degree options that fit your goals.
- Paying for Graduate School Understand costs and explore ways to pay for grad school.
-
Scholarships
- Scholarships
- $2,000 No Essay Scholarship Enter to win our no essay $2,000 college scholarship in 2 minutes or less.
- Scholly Scholarships Easily find and sort through thousands of college scholarships for free.
- Scholarships for High School Seniors Explore scholarships for high school seniors and get tips on how to apply.
- Scholly Easy Apply Scholarships Apply for up to $13,000 in scholarships each month with just one form.
- $5,000 Grad School No Essay Scholarship Enter to win our $5,000 no essay grad school scholarship in 2 min or less.
-
Financial aid
- Financial Aid Grants, work-study, and federal student loans can all be part of your financial aid package.
- FAFSA® Guide Learn how to answer the 2026-27 FAFSA® questions like a pro.
- Financial Aid Offers Compare financial aid offers to determine the most affordable schools for you and your family.
- College Grants Learn more about federal and state grants and how to apply.
- Federal Pell Grants Discover what a Pell Grant is, who is eligible, and how to apply.
- Financial Aid Resources Get expert guidance on maximizing your financial aid options to make education more affordable.
-
Pay for School
- Sallie Mae® Student Loans
- Private Student Loans Find a private student loan designed to fit your needs.
- Undergrad Student Loan For college students earning a bachelor's or associate's degree.
- Graduate Student Loans Choose the right loan for your graduate degree or post-graduate studies.
- Career Training Loan For students taking professional training or certificate courses.
- Student Loan Resources Everything you need to navigate student loans with confidence.

This new Sallie report focuses on AI-related education funding awarded to U.S. colleges, universities, and research institutions, as reported by the National Science Foundation (NSF). The funding data we analyzed includes research grants, education programs, fellowships, and scholarship programs that reference artificial intelligence or related fields.
Using that data, we ranked all 50 states and the District of Columbia by where AI-related education funding is growing, and how that funding is distributed across institution types and regions. For students considering college, understanding where this funding is concentrated and what types of programs it supports can be a useful starting point for planning next steps.
Key takeaways
- The U.S. has seen 2,716 new AI-related awards (including education grants, fellowships, scholarships, and program funding) since 2022, with California (+309), Texas (+211), and New York (+188) accounting for more than a quarter of that growth.
- California ranks No. 1 for AI education funding distribution, with the highest number of new awards and funding spread across more institutions than any other state.
- New Mexico ranks No. 2 for AI education funding distribution, with 69.6% going to HBCUs, tribal colleges, and community colleges (more than double that of any other state).
- The top 5 states for award growth accounted for 35.4% of new AI-related education awards (962 of 2,716 awards).
Here's a key term to know before exploring the rankings:
AI education funding: Federal money supporting AI-related teaching, research, and student programs at U.S. colleges, universities, and research institutions. Includes research grants, fellowships, scholarships, and program funding.
A state-level look at AI education funding
AI-related education funding has grown significantly since 2022, though that growth is concentrated in a relatively small number of states.
The AI education funding index
| Final rank | State | Final score | Funding volume & growth rank | Institution type distribution rank | Funding distribution rank | Program type breadth rank | Workforce-connected awards rank |
|---|---|---|---|---|---|---|---|
| 1 | California | 100.00 | 2 | 26 | 1 | 15 | 37 |
| 2 | New Mexico | 99.38 | 31 | 1 | 31 | 36 | 11 |
| 3 | Massachusetts | 86.42 | 6 | 30 | 2 | 2 | 39 |
| 4 | New York | 82.09 | 4 | 19 | 3 | 11 | 28 |
| 5 | District of Columbia | 79.68 | 1 | 7 | 46 | 31 | 49 |
| 6 | Texas | 75.84 | 3 | 23 | 6 | 25 | 25 |
| 7 | North Carolina | 73.42 | 10 | 4 | 8 | 22 | 12 |
| 8 | Florida | 72.01 | 8 | 14 | 4 | 5 | 35 |
| 9 | Tennessee | 70.44 | 28 | 6 | 11 | 7 | 9 |
| 10 | Virginia | 68.84 | 13 | 12 | 5 | 3 | 36 |
| 11 | Alabama | 68.45 | 20 | 5 | 15 | 35 | 5 |
| 12 | Montana | 68.04 | 40 | 2 | 37 | 43 | 6 |
| 13 | South Dakota | 67.22 | 33 | 30 | 17 | 9 | 4 |
| 14 | Pennsylvania | 65.35 | 5 | 27 | 9 | 15 | 37 |
| 15 | Louisiana | 64.77 | 27 | 16 | 10 | 17 | 12 |
| 16 | New Jersey | 64.09 | 17 | 20 | 7 | 13 | 34 |
| 17 | Illinois | 63.76 | 9 | 22 | 12 | 8 | 31 |
| 18 | Maine | 63.27 | 46 | 30 | 45 | 42 | 1 |
| 19 | West Virginia | 62.59 | 51 | 30 | 34 | 45 | 2 |
| 20 | North Dakota | 60.40 | 43 | 3 | 38 | 48 | 3 |
| 21 | Ohio | 59.27 | 19 | 15 | 13 | 37 | 19 |
| 22 | Mississippi | 58.54 | 39 | 9 | 35 | 26 | 8 |
| 23 | Indiana | 58.05 | 11 | 30 | 26 | 31 | 15 |
| 24 | Iowa | 56.07 | 30 | 16 | 32 | 26 | 12 |
| 25 | Arizona | 55.76 | 24 | 24 | 20 | 29 | 18 |
| 26 | Maryland | 55.31 | 15 | 11 | 18 | 14 | 46 |
| 27 | Rhode Island | 53.79 | 12 | 21 | 49 | 12 | 21 |
| 28 | Michigan | 53.31 | 7 | 30 | 30 | 21 | 45 |
| 29 | South Carolina | 52.95 | 22 | 30 | 40 | 17 | 16 |
| 30 | Idaho | 51.83 | 32 | 12 | 44 | 19 | 22 |
| 31 | Missouri | 51.74 | 23 | 30 | 24 | 24 | 28 |
| 32 | Georgia | 51.64 | 16 | 27 | 23 | 1 | 50 |
| 33 | Oregon | 51.42 | 37 | 30 | 14 | 31 | 28 |
| 34 | Colorado | 51.06 | 14 | 27 | 21 | 46 | 20 |
| 35 | Utah | 50.93 | 29 | 8 | 27 | 31 | 44 |
| 36 | Arkansas | 50.46 | 48 | 30 | 16 | 23 | 32 |
| 37 | Nevada | 50.46 | 36 | 30 | 29 | 28 | 22 |
| 38 | Oklahoma | 50.01 | 26 | 16 | 42 | 6 | 41 |
| 39 | Wisconsin | 49.03 | 21 | 25 | 41 | 39 | 24 |
| 40 | Minnesota | 48.11 | 34 | 30 | 47 | 4 | 26 |
| 41 | Connecticut | 47.00 | 25 | 30 | 19 | 30 | 48 |
| 42 | Delaware | 46.18 | 35 | 30 | 50 | 19 | 26 |
| 43 | Nebraska | 46.14 | 41 | 9 | 39 | 41 | 40 |
| 44 | Vermont | 46.08 | 42 | 30 | 33 | 49 | 6 |
| 45 | New Hampshire | 46.04 | 44 | 30 | 28 | 38 | 32 |
| 46 | Washington | 45.84 | 18 | 30 | 43 | 10 | 47 |
| 47 | Kentucky | 41.57 | 38 | 30 | 36 | 44 | 42 |
| 48 | Hawaii | 41.52 | 49 | 30 | 51 | 47 | 10 |
| 49 | Kansas | 41.34 | 47 | 30 | 25 | 40 | 51 |
| 50 | Alaska | 37.06 | 50 | 30 | 22 | 51 | 17 |
| 51 | Wyoming | 30.70 | 45 | 30 | 48 | 50 | 42 |
The U.S. has seen 2,716 new AI-related education awards, including education grants, fellowships, scholarships, and program funding, added since 2022. California (+309), Texas (+211), and New York (+188) alone account for more than a quarter of all new awards. California ranked first overall, leading in total new awards and in how widely funding was distributed across institutions.
Within that total, 102 awards came from NSF programs designed specifically to fund student scholarships, including the S-STEM Program (Scholarships in Science, Technology, Engineering, and Mathematics) and the Robert Noyce Scholarship Program, totaling $180.2 million in funding. Texas led with 10 scholarship-program awards, followed by North Carolina (8), with New York and California tied at 6 each.
New Mexico ranked second overall for AI education funding, with nearly 70% reaching HBCUs, tribal colleges, and community colleges. New Mexico also ranks among the top states for awards that include internship, apprenticeship, or workforce development components.
Here's a quick breakdown of the top and bottom 10 states, including the District of Columbia:
Top 10 states for AI-related education funding
- California
- New Mexico
- Massachusetts
- New York
- District of Columbia
- Texas
- North Carolina
- Florida
- Tennessee
- Virginia
Bottom 10 states for AI-related education funding
51. Wyoming
50. Alaska
49. Kansas
48. Hawaii
47. Kentucky
46. Washington
45. New Hampshire
44. Vermont
43. Nebraska
42. Delaware
How AI-related education funding is distributed
A closer look at each ranking factor reveals where AI-related education funding is most and least concentrated:
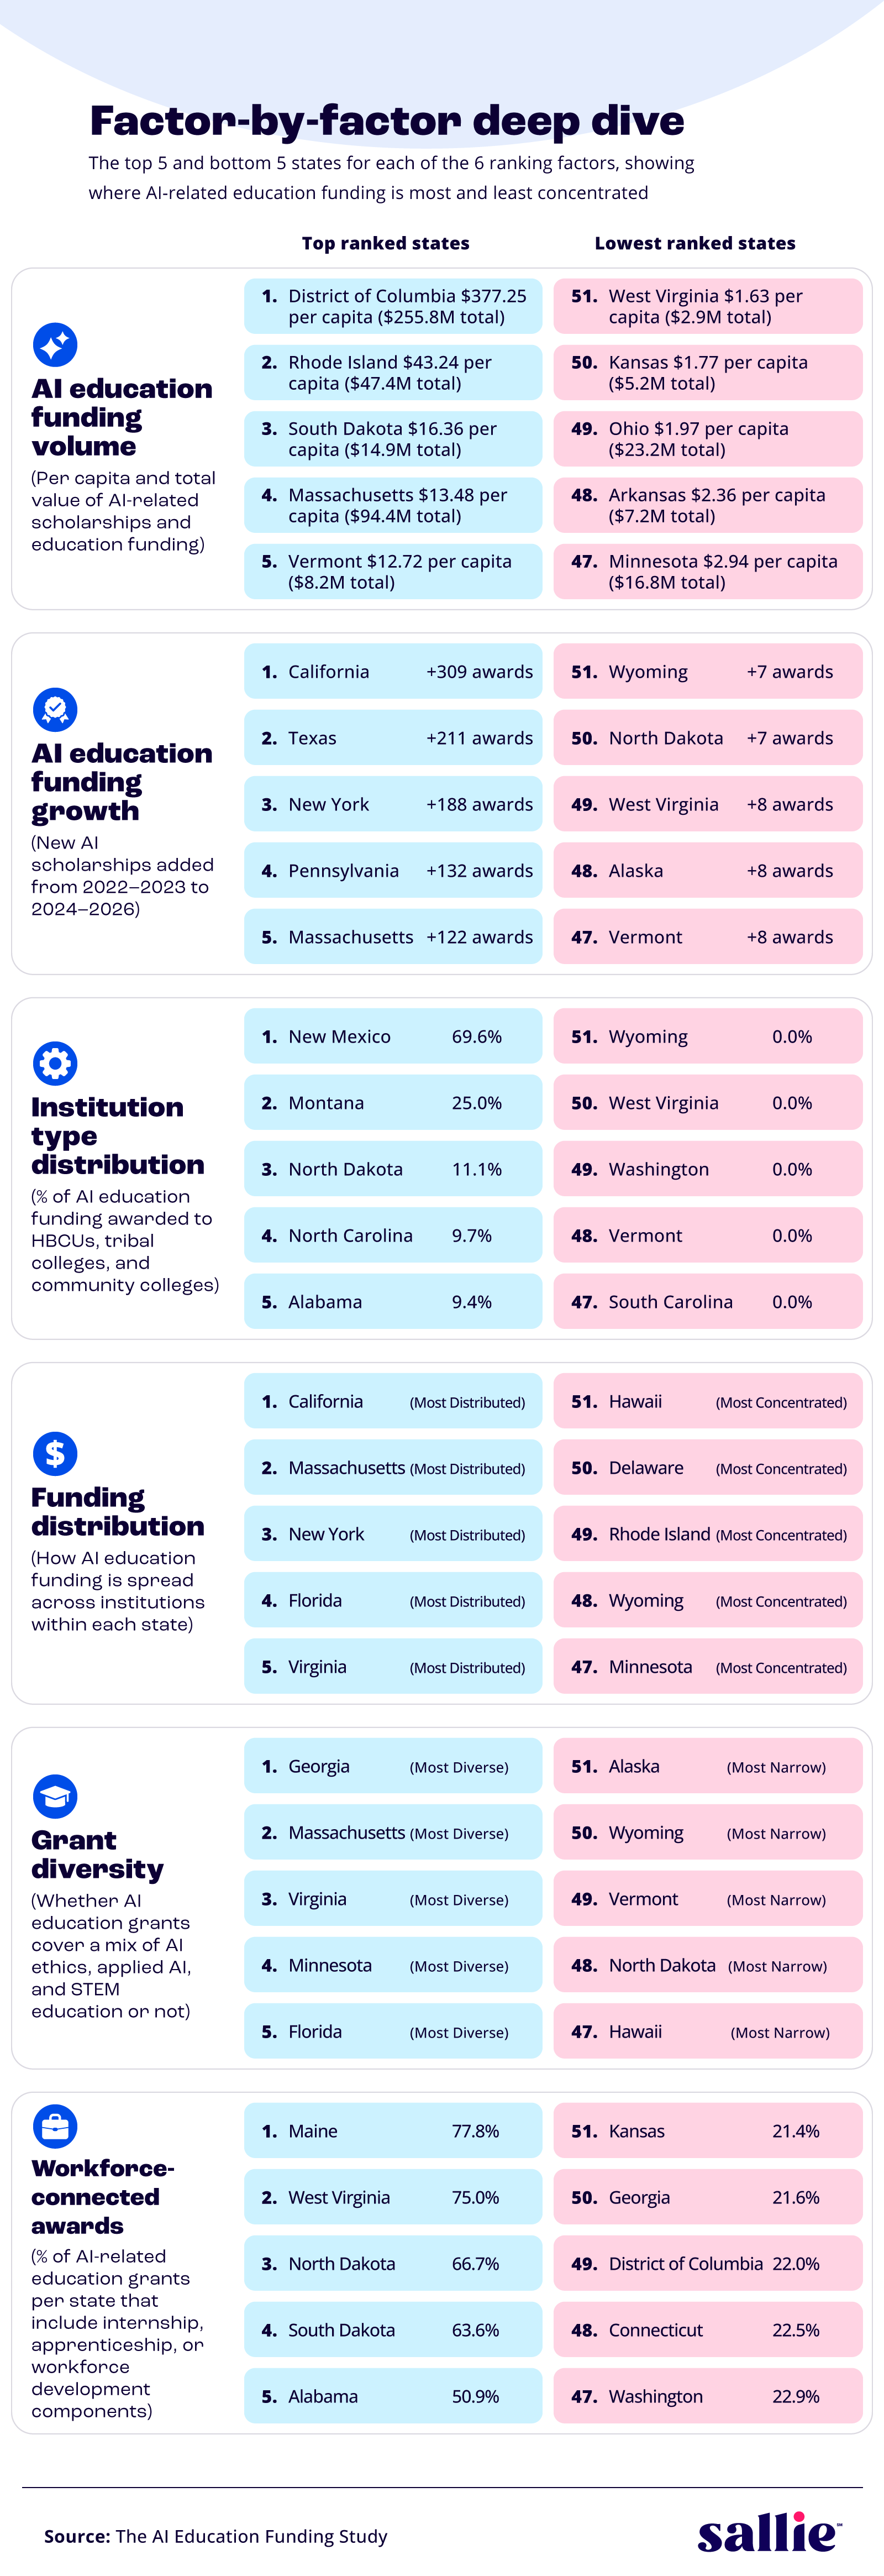
- Funding volume per capita: The District of Columbia leads at $377.25 per resident ($255.8M total), while West Virginia ranks lowest at $1.63 per resident ($2.9M total).
- Funding growth: California added the most new awards (+309), while Wyoming and North Dakota added the fewest (+7 each).
- Institution type distribution: New Mexico directed 69.6% of its funding to HBCUs, tribal colleges, and community colleges, while 22 other states directed none.
- Funding distribution: California, Massachusetts, and New York had the most broadly distributed funding across schools within their state, while Hawaii and Delaware had the most concentrated.
- Grant diversity: Georgia and Massachusetts offer the broadest mix of AI ethics, applied AI, and STEM-related funding, while Alaska and Wyoming have the narrowest.
- Workforce integration: Maine leads with 77.8% of awards including workforce development components, while Kansas ranks lowest at 21.4%.
The top 5 ranked states for AI-related education funding also differ in how their funding is distributed across AI ethics, applied AI, and STEM education. Here are the leaders in each category:
- Massachusetts stands out for its high share of awards related to AI ethics: 26.6%
- Massachusetts also has the highest share of education funding for applied AI: 42.2%
- New Mexico has the highest share going toward STEM education: 56.5%
AI education awards can be tagged in more than one focus area, so the percentages below do not sum to 100%.
AI-related education funding by focus area
| Final rank | State | AI ethics | Applied AI | STEM education | Total awards |
|---|---|---|---|---|---|
| 1 | California | 15.1% | 40.3% | 49.5% | 325 |
| 2 | New Mexico | 13.0% | 26.1% | 56.5% | 23 |
| 3 | Massachusetts | 26.6% | 42.2% | 46.9% | 128 |
| 4 | New York | 15.9% | 39.5% | 46.2% | 195 |
| 5 | District of Columbia | 14.6% | 19.5% | 48.8% | 41 |
It's also worth noting that this data tracks funding at the institutional level, not the student level. A student from any state can attend a well-funded institution and potentially access that funding.
How students can use this data
Students considering college and those who support them can use this information to focus their research geographically. Students don't have to be limited by where they live. Expanding your scholarship search beyond your home state, applying to a wider range of programs, and considering schools with stronger AI-related education funding can open up more options. Scholly Scholarship Search can help simplify that process, matching you with opportunities that fit your goals regardless of where you live.
In addition to scholarships, families can use Sallie's Scout College Search to compare schools on factors beyond cost, including funding availability, program offerings, and career outcomes.
Starting early also makes a difference. Students who begin exploring scholarships and programs before senior year have more time to build strong applications, apply to more opportunities, and make well-informed enrollment decisions.
Methodology
This index ranks all 50 U.S. states and the District of Columbia based on factors that shape how AI-related education funding is distributed across institutions and regions. Drawing exclusively from publicly available federal datasets, the index provides a data-driven look at where AI education funding is more limited or concentrated.
Data sources and factors considered
The index is built on 6 scoring dimensions organized into 5 core categories, each weighted to reflect its relative importance to how AI education funding is distributed.
Scoring categories and weights
Funding volume and award growth — 20 points
- AI education funding per capita (12 points): The total dollar value of AI-related education funding per state, adjusted for population, capturing the intensity of AI funding investment relative to the number of residents each state serves. This funding includes research grants, education programs, fellowships, and scholarship programs that reference artificial intelligence or related fields.
Source: NSF Award Search, U.S. Census Bureau
- Award growth (8 points): The absolute increase in new AI education awards from the 2022–2023 period to the 2024–2026 period, measuring whether states are accelerating investment in AI education funding or remaining stagnant.
Source: NSF Award Search
Institutional distribution — 25 points
- Institution share (25 points): The combined percentage of each state's AI education grants awarded to HBCUs, tribal colleges, and community colleges. Using IPEDS classification data as a crosswalk against NSF award recipients, this factor directly measures how funding is distributed across these institution types.
Source: NSF Award Search, IPEDS
Federal funding concentration — 20 points (Inverted Score)
- State-level funding distribution (20 points): How evenly AI education grants are spread across institutions within each state. States where funding reaches many schools score higher; states where 1 or 2 universities receive nearly all the grants score lower.
Source: NSF Award Search
Grant breadth — 15 points
- Grant diversity (15 points): Whether a state's AI education grants cover a balanced mix of AI ethics, applied AI, and STEM education, or lean heavily toward one area. States with a well-rounded portfolio score higher; states with a narrow focus score lower.
Source: NSF Award Search
Workforce connections — 20 points
- Workforce components (20 points): The percentage of AI-related education grants per state that include internship, apprenticeship, or workforce development components. States with a higher share of awards including these components score higher; states where funding is tuition-only score lower.
Source: NSF Award Search
Data notes
- The index draws exclusively from the NSF Award Search, which captures federally funded AI education grants identified through keyword analysis of award titles and abstracts. Awards that do not reference artificial intelligence or related terminology may not be captured in this dataset.
- Institution classifications (HBCU, tribal college, community college, R1) were matched by cross-referencing NSF award recipient names against the IPEDS Institutional Characteristics database. Approximately 72.8% of awards were successfully matched; unmatched awards are classified as "Other" and do not contribute to the institution type distribution factor.
- The award growth sub-factor compares new awards from 2022–2023 with those from 2024–2026. The earlier period contains a smaller sample of awards, which may overstate growth in states with minimal early activity. This sub-factor accounts for 8 of 100 total index points.
- The dataset is presented at the state level but reflects federal grants from the NSF Award Search only. It does not include funding awarded by state governments (state scholarship programs, state higher-education budgets), private foundation scholarships, corporate scholarships, or comprehensive K–12 education funding.
About Sallie
Sallie is an education-solutions company that helps guide students and families through the entire higher-education journey with trusted tools, free-money-first support, and clear guidance from day one to done. Sallie helps students find scholarships, navigate financial aid, plan for college with Scout, and feel more confident about the steps ahead.
Fair use statement
The information in this article may be used for noncommercial purposes only. If you share it, please include a link and an attribution to Sallie.