-
Colleges
-
Graduate School
- Graduate School
- Scout Grad School Search Find and compare grad schools based on your preferences, goals and academic interests.
- $5,000 Grad School No Essay Scholarship Enter to win our $5,000 no essay grad school scholarship in 2 min or less.
- Graduate Degrees Explore graduate degree options that fit your goals.
- Paying for Graduate School Understand costs and explore ways to pay for grad school.
-
Scholarships
- Scholarships
- $2,000 No Essay Scholarship Enter to win our no essay $2,000 college scholarship in 2 minutes or less.
- Scholly Scholarships Easily find and sort through thousands of college scholarships for free.
- Scholarships for High School Seniors Explore scholarships for high school seniors and get tips on how to apply.
- Scholly Easy Apply Scholarships Apply for up to $13,000 in scholarships each month with just one form.
- $5,000 Grad School No Essay Scholarship Enter to win our $5,000 no essay grad school scholarship in 2 min or less.
-
Financial aid
- Financial Aid Grants, work-study, and federal student loans can all be part of your financial aid package.
- FAFSA® Guide Learn how to answer the 2026-27 FAFSA® questions like a pro.
- Financial Aid Offers Compare financial aid offers to determine the most affordable schools for you and your family.
- College Grants Learn more about federal and state grants and how to apply.
- Federal Pell Grants Discover what a Pell Grant is, who is eligible, and how to apply.
- Financial Aid Resources Get expert guidance on maximizing your financial aid options to make education more affordable.
-
Pay for School
- Sallie Mae® Student Loans
- Private Student Loans Find a private student loan designed to fit your needs.
- Undergrad Student Loan For college students earning a bachelor's or associate's degree.
- Graduate Student Loans Choose the right loan for your graduate degree or post-graduate studies.
- Career Training Loan For students taking professional training or certificate courses.
- Student Loan Resources Everything you need to navigate student loans with confidence.
.png?width=816&height=457&name=header-1920X1080%20(1).png)
If you've ever wondered what could improve your odds of winning a scholarship, then you've landed in the right place. Sallie surveyed 511 U.S. scholarship applicants, including students who had won at least one award and students who had applied but never won, to identify the patterns and behaviors most commonly associated with scholarship success. A handful of habits around timing, volume and persistence showed up consistently among winners.
Key takeaways
- 63% of scholarship winners started applying during high school or earlier. Just 13% applied after high school graduation but before attending college.
- About 1 in 3 scholarship winners (34%) won 3 or more awards. This group won a median of $12,750, compared with $4,250 for winners of 1 or 2 awards.
- Over 1 in 10 scholarship winners (11%) eventually won a scholarship they had previously been rejected from, after reapplying in a later award cycle (many scholarships reopen on an annual or semi-annual basis). Among scholarship winners who reapplied after a rejection, nearly 1 in 3 (32%) eventually won one.
- Top scholarship winners applied to 11 or more scholarships at 2.7 times the rate of other winners (47% vs. 18%) and won a previously rejected scholarship at 2.4 times the rate (18% vs. 7%).
- 42% of applicants who never won a scholarship had no one review their essays. Among scholarship winners, that figure drops to 36%.
The most common habits of scholarship winners
The survey looked at when winners started applying, where they found scholarships, and how they approached the process week to week.

The top 5 self-reported habits among scholarship winners include:
- Applying for scholarships before or during high school: 63% of winners vs. 49% of non-winners
- Asking another person to review their essay before submission: 61% of winners vs. 53% of non-winners
- Aiming for scholarship awards below $5,000: 59% of winners vs. 42% of non-winners
- Researching the scholarship organization before writing an essay: 41% of winners vs. 31% of non-winners
- Applying to 11 or more scholarships: 27% of winners vs. 17% of non-winners
Most scholarship winners (63%) started early, applying for scholarships before or during high school, with 40% submitting applications in their senior year. Another 13% waited to apply until after high school graduation, while others applied during college (22%) or after college graduation (2%).
Where students looked for scholarships also varied. Applicants who never won were twice as likely to rely on social media to discover scholarships (10% vs. 5% of winners), while winners more often turned to the organizations behind the scholarships and their school's financial aid office. Beyond where they searched, most other behaviors looked nearly identical across both groups.
Several habits showed up at nearly identical rates among winners and applicants who never won, meaning they did not separate the two groups. Both:
- Spent roughly the same amount of time per week on applications (2.9 vs. 3.0 hours)
- Customized their essays at similar rates (75% vs. 74%)
- Finished most of the applications they started (85% vs. 86%)
- Didn't use AI tools during the process (75% of both groups)
- Targeted scholarships with fewer applicants (52% of both groups)
How winners and non-winners diverge
This section compares the habits and self-reported approaches of scholarship winners and applicants who never won.
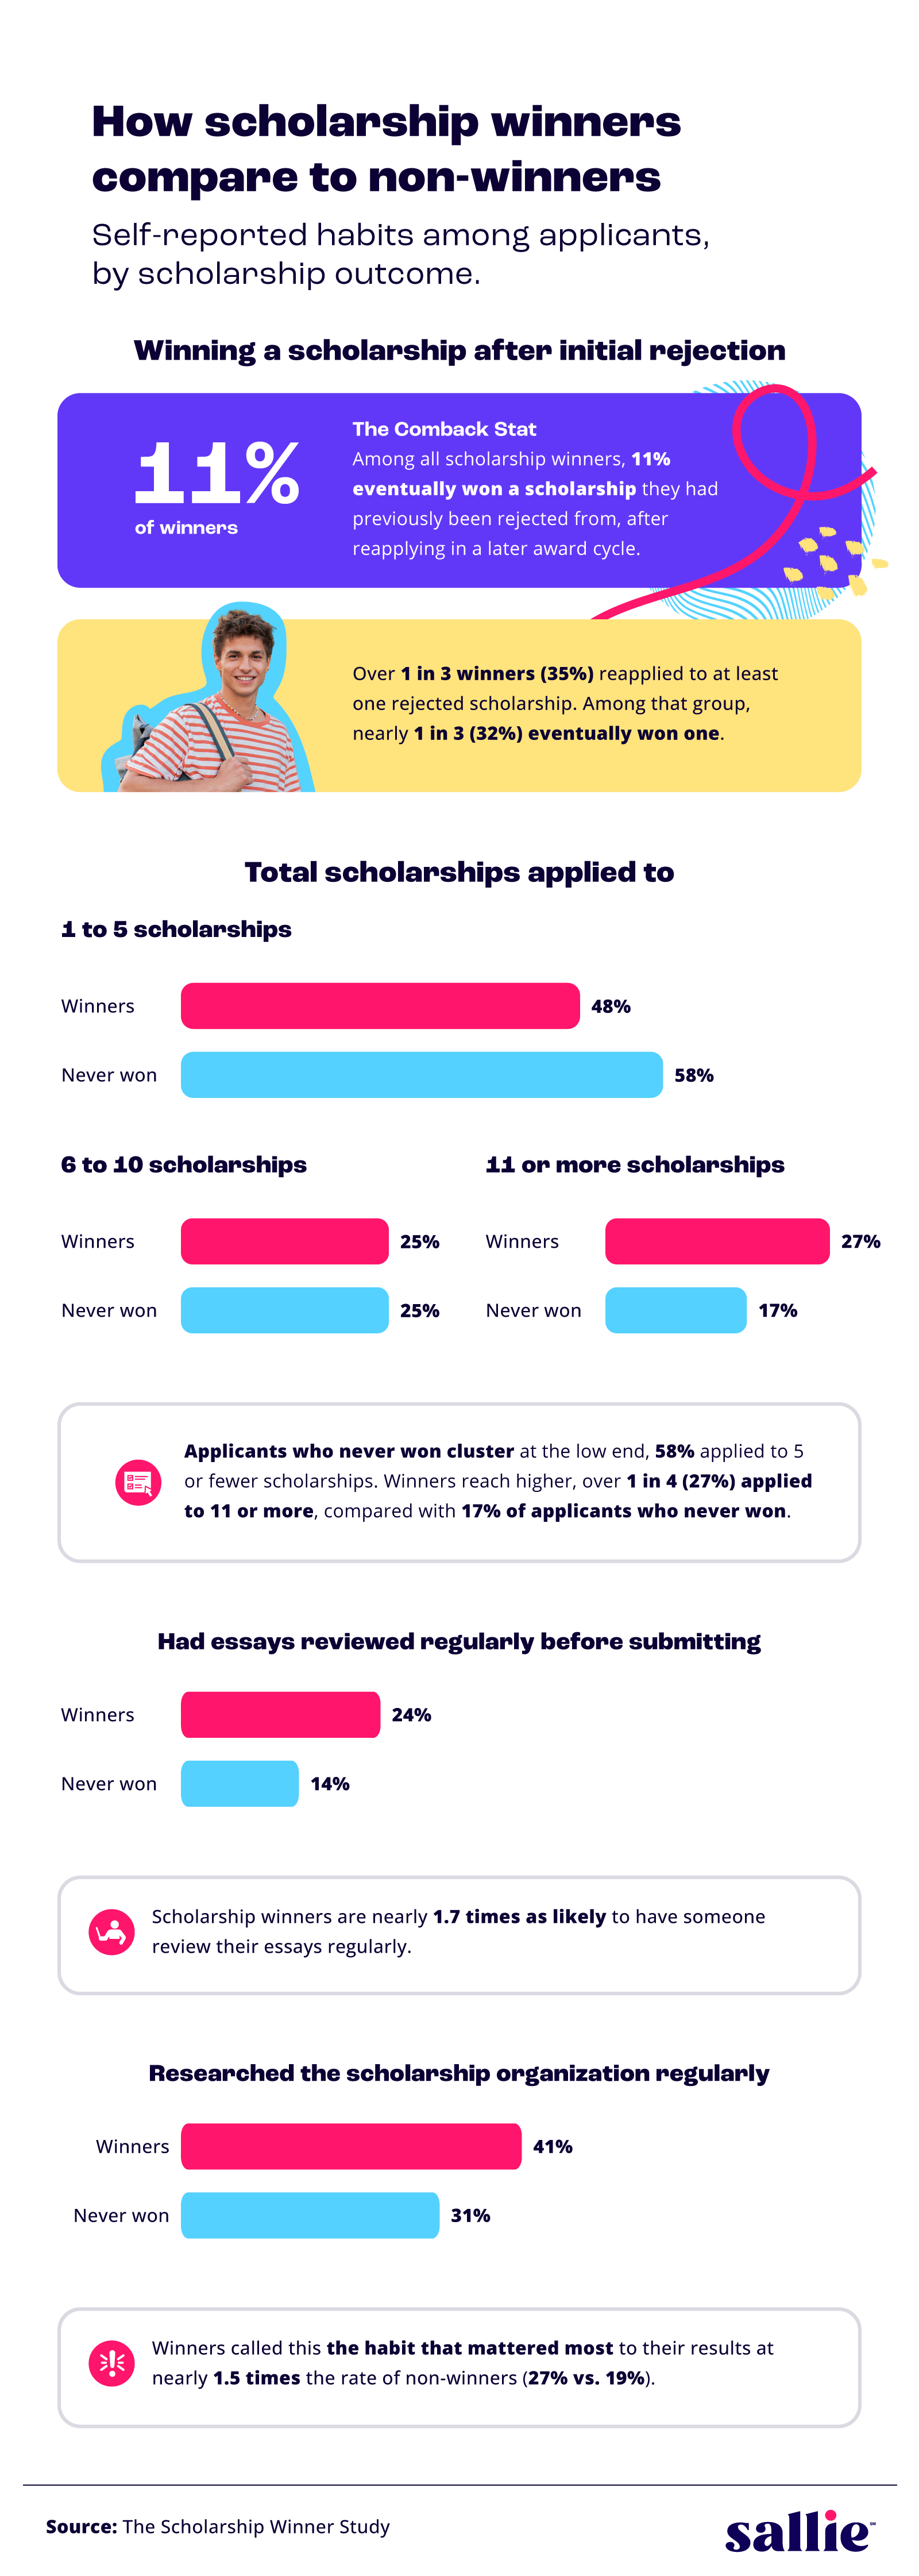
Overall, 11% of winners eventually won a scholarship they had previously been rejected from, after reapplying in a later award cycle (many scholarships reopen on an annual or semi-annual basis). More than a third of winners (35%) reapplied to at least one rejected scholarship, compared to 24% of applicants who never won. Among winners who reapplied after a rejection, 32% eventually broke through.
Scholarship winners applied to a median of 6 to 10 awards, while applicants who never won applied to a median of 3 to 5. That's roughly twice as many awards. Over 1 in 4 winners (27%) applied to 11 or more scholarships, compared with under 1 in 5 applicants who never won (17%).
Scholarship essay habits also varied between the groups:
- Nearly 1 in 4 winners (24%) had their essays reviewed regularly by another person before submitting, compared with just 14% of applicants who never won.
- Over 2 in 5 applicants who never won (42%) never had anyone review their essays, while 36% of winners said the same.
- Winners were more likely to research the scholarship issuer regularly before writing (41% vs. 31%).
Scholarship winners were twice as likely as applicants who never won to say they would change nothing about their approach (17% vs. 8%). When asked what they would change, winners and applicants who never won landed on the same regret: applying to more scholarships. For both groups, the most common wishes were to apply to a higher volume and to cast a wider net rather than focusing on a few. The main difference was satisfaction itself, winners were twice as likely to say they would change nothing about their approach (17% vs. 8%). Their top advice for first-time applicants was "Don't give up after your first round of rejections."
Inside the winner's circle
A subset of scholarship winners stood out for the volume and value of their awards. The next set of findings looks at how this group's habits compare with those of other winners.

The research identified this group as the "Winner's Circle," which includes about 1 in 3 winners (34%). Top winners earned a median of $12,750 across at least 3 awards, while other winners earned a median of $4,250 across 1 or 2 awards.
These trends showed the largest gap between top winners and other winners:
- Top winners applied to 11 or more scholarships at 2.7 times the rate of other winners (47% vs. 18%).
- They also reapplied to rejected scholarships at nearly twice the rate (49% vs. 27%).
- Top winners were more likely to start applications the day they found them (55% vs. 46%).
- Among top winners, 66% targeted awards under $5,000, compared with 55% of other winners.
Top winners were also 1.6 times as likely to keep a master document of reusable essay paragraphs (28% vs. 18%). But top winners and other winners spent nearly identical time per week on the scholarship application process, with median values of 3 and 2 hours, respectively.
A few things worth trying
The findings point to a few recurring patterns: starting earlier, applying to more scholarships, having essays reviewed, and reapplying after a rejection. The gap between scholarship winners and applicants who never won didn't show up in time spent per week, essay customization rates, or completion rates, which were nearly identical across both groups. Whether you are just beginning the scholarship process or already partway through school, the data offers a useful starting point for what to try.
A few habits are worth putting into practice. Start before you have everything figured out. You don’t need to have picked a school to begin, and high school seniors can get a head start with scholarships built for their year. Apply to more, since winners consistently cast a wider net, and Easy Apply scholarships let you submit one application and be automatically entered for multiple awards, which means more chances to win with no extra effort.
And make the search itself easier. With Scholly Scholarship Search, find legitimate scholarships from a range of organizations, hone in on your best matches, stay on top of deadlines, and apply faster. Whether you are just starting out or already partway through school, applying every year—and reapplying to awards you did not win the first time—gives you more chances to break through.
Methodology
A survey conducted by Fractl on behalf of Sallie surveyed 511 U.S. scholarship applicants in 2026, including students who had won at least one scholarship and students who had applied but never won, about the habits, strategies, and decision-making patterns they used during the scholarship process. Two-thirds of respondents (67%) had won at least one scholarship, while one-third (33%) had applied but never won. The survey is observational and based on self-reported responses, so the behaviors described were associated with winning rather than shown to cause it.
The gender breakdown was 61% women, 36% men, and 3% non-binary or prefer not to say. Generations represented include Gen Z (69%), millennials (23%), and Gen X (7%), with a mean age of 28 years. Respondents attended a mix of institution types, including public four-year universities (58%), private four-year universities (18%), community colleges (18%), online universities (4%), and trade or vocational schools (2%).
About Sallie
Sallie is an education-solutions company that helps guide students and families through the entire higher-education journey with trusted tools, free-money-first support, and clear guidance from day one to done. Sallie helps students find scholarships, navigate financial aid, plan for college with Scout, and feel more confident about the steps ahead.
Fair use statement
The information in this article may be used for noncommercial purposes only. If you share it, please include a link and an attribution to Sallie.